ATD Blog
5 More Business Reasons Why xAPI
Thu Oct 05 2017


If your responsibilities include onboarding team members, developing learning curriculums, delivering training programs, or evaluating the performance of your organization, at some point this year someone likely asked if you had looked into xAPI. The conversation probably went one of two ways. You either replied, “Absolutely. I’m really excited about it, but I’m having a hard time getting other people on my team onboard.” or “No I haven’t, what is that?”
Either way, someone probably jumped into a technical explanation about how xAPI is a magical data interoperability standard that is going to solve all of your training tracking and performance measurement challenges. While that isn’t necessarily the wrong answer, it’s not really helpful for increasing buy-in and understanding across your team. Instead, we like to think about how to xAPI from a less-technical, more outcome-oriented approach to help you move the conversation to next steps.
In other words, we want to answer the question: “Why xAPI?” In our previous post, we offered five top business reasons for using xAPI. Here are five more that can help you make your case to others.
Connect Learning to Business Objectives
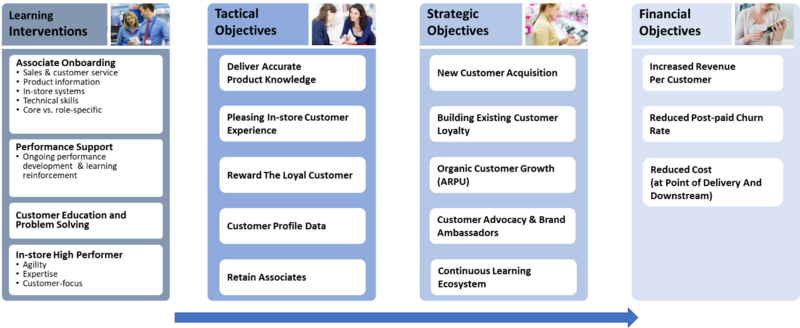
In order to meet the needs of the business and measure the success of your learning program, you need to create a strategic plan to collect data to link learning solutions to business outcomes. Figure 1 shows how this works in a typical sales enablement program (see below).
Figure 1: Connect Learning to Business Objectives

Working from left to right, we see learning interventions and common tactical objectives. Collaboration with sponsors helps define which KPIs are tied to strategic objectives. Meanwhile, financial objectives usually involve a combination of outcomes that drive revenue and reduce cost.
In most organizations the data exists for the KPIs shown in Figure 1, but it is difficult for L&D to get this information without ongoing support from executive sponsors. For sustained success, a continuous flow of data is necessary to demonstrate a causal relationship from downstream activities, such as learning, to KPIs at the level that tie to financial performance.
Here’s the good news: xAPI has the flexibility to gather data along the cognitive value chain to help correlate impact.
Escape Pivot Table Purgatory
For those who have tried to perform analysis of learning, the primary tool has been the spreadsheet. There is a plethora of data out there, and mining it by hand can be an interesting exercise. But working with multiple data sets, in different formats, owned by different people in an organization is pure hell. What’s more, it’s often the chief reason that sustained data collection and analysis fails.
It’s time for L&D professionals to get out of the spreadsheet business. The table below pinpoints some of the issues with common spreadsheets.

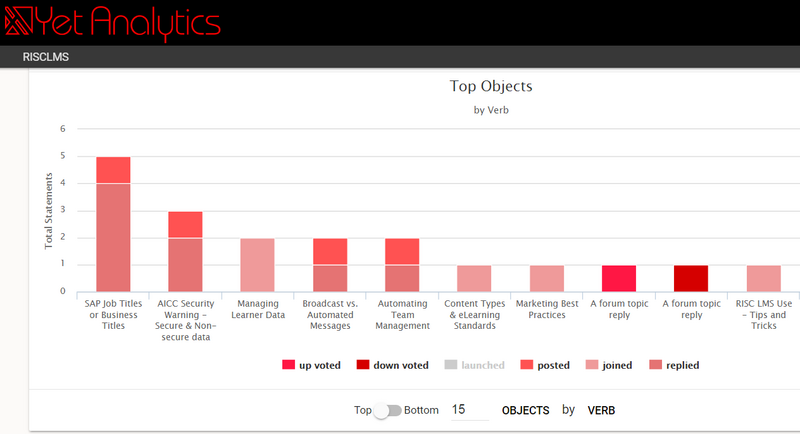
Fortunately, xAPI can automate the data collection and analysis process. Consider the data visualization in Figure 2. In this example, the xAPI-enabled RISC Virtual Training Assistant Forum (VTA) passes data on all kinds of interactions, providing live information on popular topics and active users across the forum, making it easy to see who is most engaged and which topics are getting a lot of attention—all in real time. The figure highlights the most popular topics in the RISC VTA Forum, along with the actions associated with those topics.
Figure 2: xAPI-Enabled Data

Clearly, live xAPI data collection and analysis provides content managers with the information they need to identify topics that need more resources, users who need help, and superstars who are providing extra value in the forum by helping their peers.
Get Out of the Data Waiting Game
On the road to data optimization of analytics, there are three key activities: extraction, transformation, and loading. Often referred to as ETL, this process is essential for sustained data analytics and it is one of the reasons that working in spreadsheets is so problematic.
For most organizations and analysts, ETL is the part of the process where there is an extended waiting period. Specifically, there can be a lag between when the learning activity happens, when data is created, and when that data is accessed. Indeed, sometimes this cycle is completed only on a quarterly basis. xAPI ends this waiting game—and depreciating relevance of data—by creating a continuous feed to a learning record store (LRS), which is a data warehouse for xAPI data statements about employee activity, learning, behavior, and performance, as well as other system level activities.
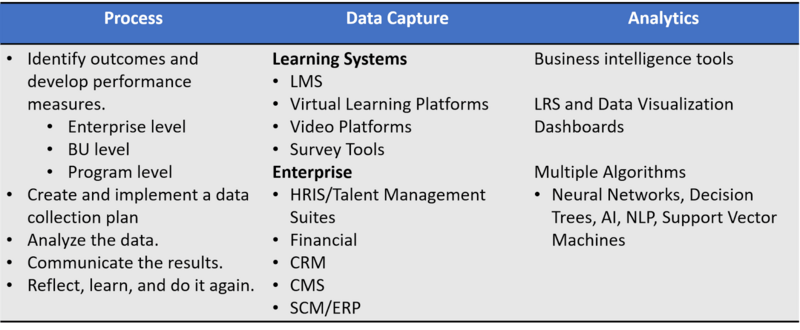
However, getting all your data in one place isn’t your only consideration. You also want to make sure that you get the data that makes sense. Enter the data collection plan (see table below). Your data collection plan will help you identify outcomes and develop performance measures and KPIs at the enterprise, business unit, and program level. It also identifies the systems that are necessary to supply the data—not just learning-related systems but key business systems that hold critical information about the long-term impact of your employee lifecycle.

With the data in the LRS, you can use built-in data visualization and business intelligence tools to analyze the data. By applying analysis, you’ll be able to provide insights to the business and create a better experience for learners. To aid in designing data collection and map data to key areas of the organization, consider using Design Thinking tools, Riskiest Assumption Test (RAT), and Business Model Canvas.
This is not a simple exercise, however. If the L&D profession wants to remain relevant in a rapidly changing world, we need to take some calculated risks and invest in the right areas.
Build the Foundation for a Data Driven L&D Program
The data collection and analysis made possible with xAPI provides a foundation for a data-driven L&D programs. In fact, xAPI data collection and analytics offers major returns for key stakeholders.
Benefits to learners include:
a personalized learning experience that delivers content based upon role, experience, preference, and interests
increased speed to proficiency and success
integration with services that deliver context-aware content to support learning at the point of need.
Meanwhile, benefits to the business include:
capability to select employees who are mostly likely to succeed in the role selected
training initiatives that drive business outcomes
identification of employees with high potential and ability to prescribe personalized learning paths that support leadership development.
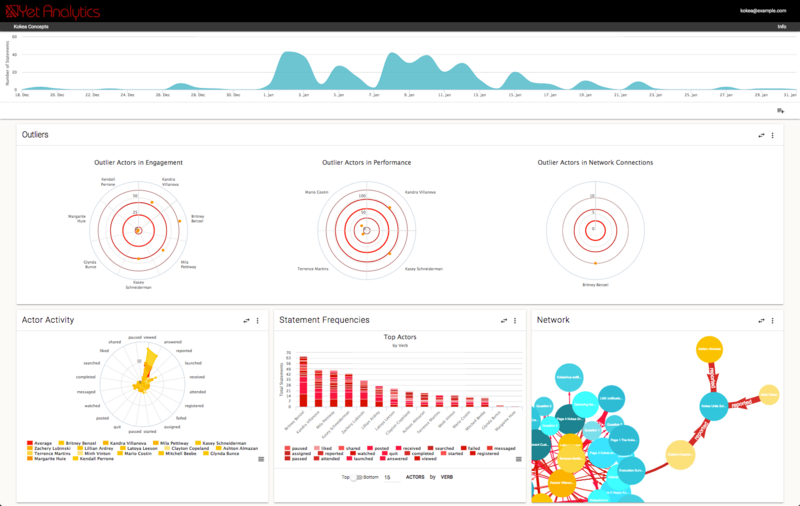
Finally, the overall benefit to the L&D function is a better understanding of what actually works in learning to improve practices and programs and, more importantly, alignment of learning to business needs. See the figure below for a sample of data options.

Show the Business Value of L&D
In the end, it all comes down to respect—and ROI. As a whole, L&D has not done a very good job at reporting results to leadership. Most executives and L&D professionals believe that developing employees is important for organizational success. However, delivering measures on business impact and ROI is, as we’ve discussed, challenging due to many complex issues.
In the 2017 Workplace Learning Report, LinkedIn surveyed 500 L&D professionals in the United States and Canada and found that only 8 percent of CEOs see business impact measures, while only 4 percent see ROI metrics. xAPI can power the business with the mission-critical data needed to reverse these statistics.
xAPI and the Future of L&D
We are working in a time of great challenge and opportunity. Data is the fuel needed for informed decision making, and L&D is primed to start activating relevant, granular data that connects the experience across the entire employee journey. With xAPI, L&D will be empowered to begin a new era of data-driven learning through measurable impact, high-value results, and significant ROI to stakeholders and decision makers across the business.
You've Reached ATD Member-only Content
Become an ATD member to continue
Already a member?Sign In
