ATD Blog
Leveraging Words and Visuals in Training
Tue Mar 27 2012


Whether you are a facilitator or a designer-developer of training materials, your basic communication tools are: visuals (static or animated) and words (printed or narrated). Is learning better when you add graphics to your lessons? When you display an effective visual, is it better to explain it with audio narration or with text? When are animated visuals more effective than a series of still visuals? In my next few articles in this series, we’ll look at what research has to say on these issues.
Guideline: Augment Words with Relevant Visuals
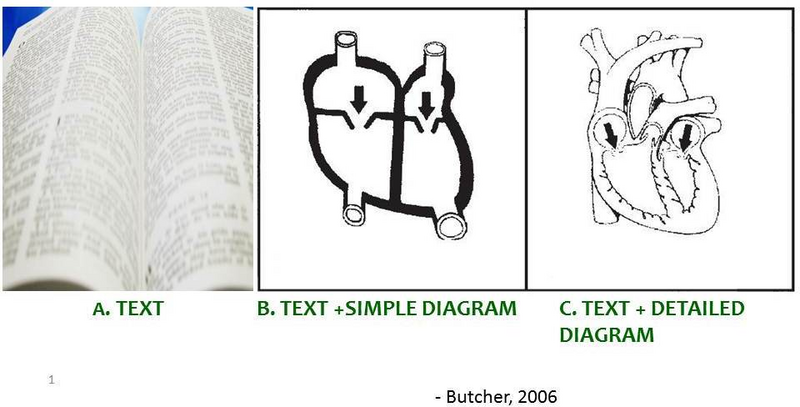
In controlled experiments in which the same content was communicated with either relevant visuals and words or with words alone, the versions with visuals resulted in significantly better learning. For example a lesson on how lightning forms that included simple visuals illustrating the process resulted in better learning than the same lesson with text alone. On average you can expect about a 1.5 standard deviation improvement when you add relevant visuals to your instructional explanations. But there are some caveats! First, graphics are most beneficial for learners who are new to the content. Learners with related experience can most likely form their own images as they read or listen to the words. Second, visuals must be relevant to the learning goals. Visuals added as decorative elements will not enhance learning and in some cases may even degrade learning. Finally, take a look at the three lesson versions shown below. The goal of the lesson was to teach how blood circulates through the heart. Which version do you think led to the best learning?
Based on what we already discussed, the text-only version was not as effective as text with either of the added visuals (Butcher, 2006). Between the two visuals, the most effective was B – the simpler line drawing. Keep in mind that the goal of the lesson was to teach blood circulation – not heart anatomy. A general guideline is to use the simplest visual you can to support your learning goals. For example, for many purposes a line drawing will be more effective than a photograph because it does not impose as much visual noise.
No Silver Bullet
As we review research on different learning environments, we will find few invariant rules. Based on evidence, we won’t be able to claim that games or graphics or collaboration are always a good idea. Rather, evidence points to more nuanced guidelines. We will find that the effectiveness of any instructional method will depend on a) the learning goal b). the prior knowledge of the learner and c) features of the specific method. For example graphics have great potential depending on how the graphic is designed, the intended learning goal, and the related background knowledge of the learner.
Coming Soon
In the next edition of Evidence-Based Best Practices, I’ll review recent research on animations – when to use them and how to design them for maximum learning as well as when it’s better to explain a visual with text or with audio narration.
For More Information
Butcher, K.R. (2006). Learning from text with diagrams: Promoting mental model development and inference generation. Journal of Educational Psychology, 98, 182-197.
Clark, R.C. & Lyons, C. (2011). Graphics for Learning – 2nd Edition. San Francisco: Pfeiffer
Mayer, R.E. Instruction based on Visualizations. IN Mayer, R.E. & Alexander, P.A. (2011). Handbook of Research on Learning and Instruction. New York: Routledge.
You've Reached ATD Member-only Content
Become an ATD member to continue
Already a member?Sign In
