ATD Blog
The State of the Industry Is Available, Now What Do I Do With It?
Mon Feb 23 2015

Every year ATD Research gets asked the same question, when will the new State of the Industry data be available? The data is always released in the fourth quarter and typically has a feature article in the October issue of TD. After the initial excitement of receiving the data, the questions begin rolling in:
Okay so, now what?
What does this mean?
What exactly is included in direct learning expenditure?
How can I calculate my organization’s data?
Are we spending enough on learning? Or too little?
Answering Your Questions
ATD Research attempts to answer all of these questions and others in many ways. Of course, the first avenue is the report itself. While the figures, charts, and graphs can stand alone and be used to explain each of the 13 financial metrics, reading the text from the “Executive Summary” through the “Conclusion” gives insights and explanations.
For example, direct learning expenditure includes T&D staff salaries (including taxes and benefits), travel costs for T&D staff, administrative costs, non-salary development costs, delivery costs (such as classroom facilities and online learning technology infrastructure), outsourced activities, and tuition reimbursement. It does not include the cost of the learner’s travel or lost work time while engaging in learning activities.
Another helpful resource for those looking to calculate their own data for comparison is to take a look at the survey. By reviewing the survey you can get the definitions and see how organizations were asked to respond to the questions.
Don’t miss out on the webcasts. Two are done every year, one in December and one in March. During these webcasts we run through the charts, explain what we are seeing, and answer questions from the chat box. This will give you an opportunity to hear others questions and have your own questions answered. However, we know it isn’t always easy to really get to your question across in a chat box so that leads us to the next option, email!
In the back of the report and on the ATD website, you can find the authors’ direct email addresses and our department address is [email protected]. All of these will put you in contact with ATD Research staff who will be happy to discuss the report with you and do our best to answer any questions you may have.
Are We Spending Enough on Learning?
However, that last question (are we spending too much or too little?) is a tough one! Each organization is unique and what may be healthy for one organization maybe unhealthy for another. We try to give you the data to benchmark against to make the best comparison possible.
In the report, there are tables. The data in these tables are very valuable as you benchmark your organization. They allow you to make comparisons to organizations similar in size and industry to your own. We do this because we can see there are differences in these groupings.
And we know not every industry is included, but we would happily break them out if we get enough respondents in the group. So, once you figure out your organizations data to make comparisons, don’t forget to submit your data to be included in the next annual State of the Industry report.
Learn More and Sign Up for the Webcast

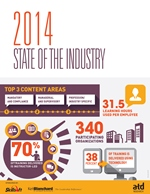
Wait, one more thing! Want to quickly share the findings with someone without pulling graphs and writing explanations? We have an infographic available which will give you and your busy colleagues a quick, fun, graphic look at the results that is perfect for sharing. It can be found on the State of the Industry report page on our website along with other helpful information such as how to download the full report.
ATD Research is hosting a free webcast on the State of the Industry on March 12, 2015, at noon. The webcast is free and you can register online here.
You've Reached ATD Member-only Content
Become an ATD member to continue
Already a member?Sign In
