CTDO Magazine Article
The Powerful Metrics of Short Sims
track short sims to better understand your learners
Wed Apr 15 2020

Bookmark
Track short sims to better understand your learners.
Most organizations in the education industry live and die by learner metrics. Those that use short sims—quick, engaging, "learning to do" online learning content—get better metrics than those that use traditional content alone or full games.
How?
Traditional online learning today is linear. The transcript for each learner consists only of starts and stops and perhaps how they did on some multiple-choice questions. In contrast, when used, game-like computer learning experiences produce too much data. Even after massive analysis, conclusions about learner behaviors are ambiguous.
Short sims, however, produce streamlined transcripts of learners that companies can easily act on.
Less talking, more doing
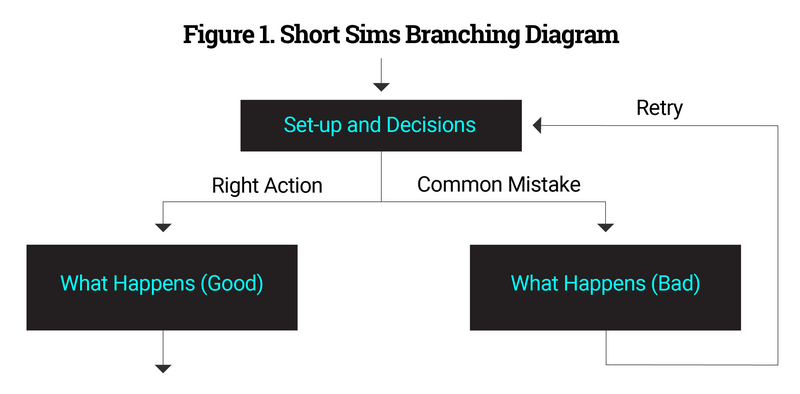
Short sims are a revolutionary form of microlearning that focus on less talking and more doing. They have evolved from traditional branching stories, and use a similar core mechanism.

Source: https://www.shortsims.com/play
But to enable richer, more efficient learning while maintaining their simple structure, short sims typically have added coach characters, are about 10 minutes long with many decisions per minute, can involve more interactive visuals, and are often open-ended enough to encourage learners to replay them. Organizations typically deploy short sims in multiple modules, mixed with traditional content and sometimes a final assessment.
Measuring learning and learner engagement
To understand and calibrate short sims, most organizations use metrics to answer two sets of questions:
Learner performance. How well does the course improve learners? Are there important points that many learners are not getting?
Learner engagement. When and why do learners disengage from the content, either physically or emotionally?
Let's explore each of these more closely.
Learner performance
Learner performance is the most important issue for an organization. You can employ several strategies around short sims. Note: You can use these approaches with any of numerous data-crunching tools, including traditional spreadsheets.
Measuring moments of truth. Start by identifying and tracking how learners do in critical decisions near the end of the course. Are 70 percent of learners making the right decisions? If not, you need to rebuild the course to better reinforce the concepts.
Alternatively, if 95 percent of learners are getting it right, it may be useful to make those moments of truth a bit more challenging. Your approach can include a formal assessment, but that is not required.
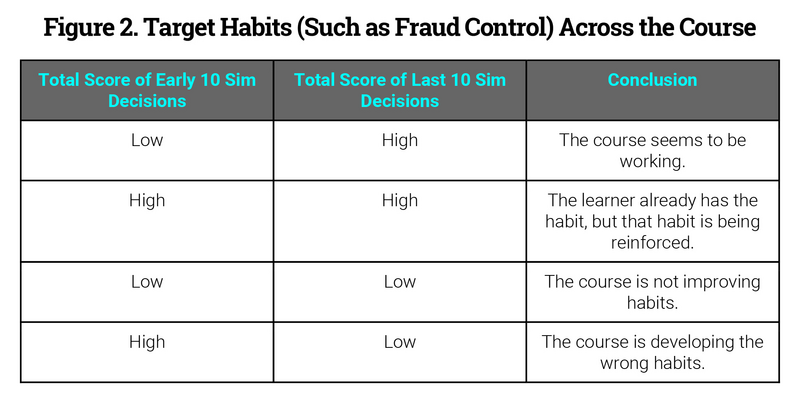
Measuring habits. A second layer is to identify and track how learners adopt target habits across all of the sims in the course. Depending on the course, in a corporate setting, those habits could be around customer service, ecosystem thinking, a focus on profitability, security and fraud protection, or adherence to policies. In an academic setting, these could be centered on application of the scientific process, fighting confirmation bias, the Socratic Method, or showing work.
Identify every relevant decision across all of the sims in the course per each target habit, and then track learner activities separately. Record +1 for every time a learner makes the right choice and -1 for every time a learner makes a wrong choice.
From that approach, companies can see patterns. Every learner should be making more right choices (and generating more points) as they progress in the course, even as their decisions get harder and more nuanced.

Factor in confidence levels. You can go deeper than this, and some organizations do. Look at the time it takes for learners to make decisions by reviewing the xAPI data.
For analysis purposes, the right answer made with low confidence—that is, it takes more than six seconds—can serve as a 50 percent proxy for wrong answers. In other words, instead of giving choices made accurately but slowly +1 scores, assign them -0.5.
Factor in demographic information. To better understand the results, factor in demographics in any regression analyses. Specifically:
Are right and wrong answers geographically correlated?
Are right and wrong answers correlated around job experience (grade)?
Are right and wrong answers correlated around role or background?
There may be one of two root causes for correlations: The program is getting caught up by some sweeping organizational issues (such as a morale crisis in Arizona), or the program has biases that exclude segments.
When there is some organizational crisis causing an outlying and localized depression of results, the remediation is extra development—that is, outside of development, not more development. And you should pass this insight on to others in leadership.
To address the second root cause, the go-ahead plan is language and content reviews by individuals from the affected demographic, with the possibility of the company developing a forked version and launching that version for the affected demographic.
For example, in a retail sector sim, the dialogue around problem solving with customers may need to be different in the Southern scenarios than the Northern scenarios in the US, so the retailer would use two versions that differ only in idioms and discussed products.
Factor in real-world data. You can also measure shorts sims against real-world data, where available. Specifically, compare:
learners' performance with their course experiences to identify where the course failed to develop the necessary skills
the performance of learners who went through the course compared to those who did not
the performance of learners and their assessment scores.
Learner engagement
After reviewing learner performance, consider learner engagement.
Start by looking at course dropouts. Organizations will want to reduce those directly, but they can also use them to identify confusing or tedious elements of the program.
First, identify the cost of a dropout. For example, in situations where learners have a choice between face-to-face classrooms and online courses, the cost of an online dropout is the cost of that person going through the class.
In a short sim around upskilling salespeople to better sell next-generation technology, the cost of a dropout includes the cost of missed or suboptimized sales, which may have been determined in the original return-on-investment calculations for the program. That gives you a budget.
Next, identify dropouts' behavior. Study the data to look for patterns in the two minutes and seven minutes before they dropped out. Consider these questions:
Is there a single place in the program where a disproportionate number of learners leave?
Is there a single module?
Is there a consistent type of engagement, such as linear, linear sim, linear activity, abstract sim, knowledge check, or assessment?
Is there a consistent type of user behavior (such as multiple wrong answers) that leads to learners dropping out?
Then identify the opportunities for course improvement that either have a ROI or a low cost. Those may include changes to specific sections or a sweeping adjustment of the entire program, such as every transition from sim back to linear.
In one example around high-potential employees, about 40 percent of the dropouts occurred when the linear content went on too long without a break of a sim or a video. The company moved some content around and added one new sim; that reduced the total dropout rate by about 25 percent.
As with performance, organizations can add conviction metrics—places where learners took a long time to answer a question—and use those as statistical 50 percent proxies for dropouts where a correlation exists with actual dropouts.
As with measuring performance, demographic data correlations with dropouts may require different adjustments. For example, a large consulting organization had a statistically relevant correlation between dropouts—and long delays in answering—and employees who had been with the company more than 12 years. The company created a forked version that made more of the early content optional and added additional relevant examples.
Short sims are not much more expensive or time consuming or technology dependent than traditional content, once you have developed the skill set. But when the heart of educational media is decisions not lecturing, everything changes—including metrics. And this is just scratching the surface of this new approach.
Read more from CTDO magazine: Essential talent development content for C-suite leaders.
More from ATD
