The Public Manager Magazine Article
Keep Your Training Program Funded: 10 Steps to Training ROI
It is easy to focus on the quality of training rather than the impact of the learning. To prove value, shift thinking from a quality mindset to an impact and results mindset.
Mon Dec 24 2012
Bookmark
It is easy to focus on the quality of training rather than the impact of the learning. To prove value, shift thinking from a quality mindset to an impact and results mindset.

Learning professionals and managers have always been tasked with building the talent required to meet public demand for better and more services. Now they are asked to do it with less money and fewer resources, and that likely will not change anytime soon. Every dollar must be justified, and if managers are unable to prove that training programs deliver more value than they cost, they put their programs in jeopardy. Proving value over cost is the essence of return-on-investment (ROI). Here are 10 important steps to proving training ROI.
Step 1: Understand the Common Misconceptions of ROI
I don't need it. People intuitively understand the value of training. Generally, people understand that learning programs bring value to the organization, but that is not the issue. The issue is how much value? Not every worthwhile initiative gets funding. In an environment of scarcity, the challenge for learning professionals and managers is to keep critical development programs at the top of the list. ROI is the best weapon.
If someone wants to see ROI they will ask for it. If ROI is important, then why aren't people asking for it? Agencies are not looking for reasons to justify programs—they are looking for reasons to cut them. If learning professionals and managers do not stand up and make the case for human capital development, no one else will.
It is very difficult, if not impossible, to calculate ROI. Calculating ROI can be difficult and expensive, particularly when the value of training is not conveniently quantifiable. There are ways to calculate ROI that are easy, inexpensive, and most of all effective. Learning professionals and managers only need to prove that their training programs are cost justified. There is always a "cost of capture" when it comes to measuring anything. In other words, it is not going to do a lot of good to spend half of next year's training budget trying to justify how this year's was spent—the juice has got to be worth the squeeze.
Step 2: Get Your Head Straight
ROI is more than a calculation; it's a way of thinking. It is easy to focus on the quality of training rather than the impact of the learning. While quality is important, it doesn't go far enough in determining value. The assumption that quality leads to learning and learning leads to impact is not necessarily true. To prove value, shift thinking from a quality mindset to an impact and results mindset. This requires a willingness to accept responsibility for the actions of delegates after they leave the learning event. That may appear to be a risky move, but in reality, status quo is the real risk.
Step 3: Start Early, Calculate Continuously
Although it is possible to calculate ROI after the fact, it is not advisable. One of the core benefits of ROI is the opportunity to make adjustments to the training program along the way. Suppose, for example, that after two years of running a program the ROI comes up negative. That's two years where costs exceeded value—not a helpful analysis when it comes to justifying the program. ROI should be viewed as a real-time process. By calculating ROI continuously, program benefits are always known. If the number is trending toward the red, the root cause can quickly be identified and action can be taken.
Step 4: Select a Methodology
There are two ways to calculate ROI: measure actions or measure opinions. While measuring what people do is better than measuring what they think, this is not practical for most training programs. A survey approach to ROI can be effective and efficient; good survey methodology is the key.
When surveying opinions, the more data points the better. ROI must be credible, and that means providing as many different perspectives as possible to validate the data. As most students are asked to complete course evaluations, surveying students for ROI simply means adding a few extra questions to the evaluation. If possible, include the student's manager or colleagues in the evaluation process to enhance the credibility of the ROI number (more on this in step 6).
Step 5: Build the Survey
Remember math class: it is not enough to show the correct answer; demonstrating how the answer was achieved is important. Three prerequisite measures are critical lead-ins to showing ROI: learning effectiveness, job impact, and business results. These are important not because they are required for the math (only job impact is needed), but because they provide quantitative proof to support the final conclusion. Training effectiveness supports job impact, which supports business results, which leads to positive ROI.
Learning Effectiveness Measures
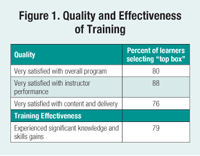
Learning effectiveness provides proof that learning did, in fact, occur. The question will typically ask the student to what extent they experienced gains in knowledge and skills as a result of the course. This is often done on a Likert scale and presented along with quality measures in a "top box" format. Top box analysis, which groups responses that agree or strongly agree, works well for quality and effectiveness measures because it is conservative and tends to show deviations that might get lost through simple averaging. Figure 1 shows the results of a top box analysis performed by ESI International in a survey of 30,000 students who took project management training.
Job Impact Measures
Also ask students about their ability to apply learning on the job and to what extent the training has improved their work effectiveness. Seek to understand how quickly students are able to apply new knowledge and skills, and to what extent the training contributed to increased job performance and productivity. Job impact is best measured in a post-event survey 30 to 90 days after the class, not from the course evaluation. The following measures are from the ESI survey, and demonstrate how job impact measures are typically expressed.
Sixty days after the class, 70 percent of the learners responded positively when asked whether they were able to successfully apply the knowledge and skills they learned to their jobs.
Eighty percent said they had used the knowledge and skills they learned within six weeks, and an additional 18 percent reported that they plan to use it in the near future.
Sixty days after the training, 66 percent of the learners reported that the training had contributed to a significant improvement in their job performance.
On average, learners reported a 9 percent improvement directly tied to the training investment.
The really critical measure here is the last one, percent performance improvement directly resulting from the training. The percent increase in performance is critical to the ROI calculation, which cannot be calculated without it.
Business Results Measures
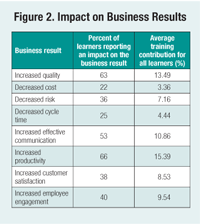
It is not enough to claim that the organization was positively affected. Quantitative evidence must be provided to show specifically where and by how much. To accomplish this, ask questions related to specific desired outcomes and by measuring the extent to which the training impacted each. Figure 2 shows data from the ESI project manager survey and demonstrates how business results might be quantified.
Step 6: Create a Post Event Feedback Loop
Learning effectiveness measures can often be integrated into standard course evaluations, and though possible, it is not advisable to try to predict job impact and business result measures. Data for these critical measures should be captured in a post-course survey delivered 30 to 90 days after the course was delivered. The delegate's manager also should be surveyed to corroborate the findings. Of course all three surveys—the course evaluation immediately after the class, the post course student survey, and the post course manager survey—should be structured so that the data can be validated among them.
Step 7: Determine a Cost Basis
ROI cannot be calculated without knowing the investment. Understand training-related costs, such as
the per student loaded tuition costs (including courseware, instructor, instructor T&L, venue costs, snacks, administrative costs)
the average salary of the attendees
Don't get buried in numbers. Estimates should be as close as possible, but only need to be approximate averages, so do not go digging up actual salary information. For example, average salary may be taken from https://www.indeed.com/salaries.
Step 8: Do the Math
The most important number in determining ROI for a learning program is the training's direct contribution to performance improvement. In the ESI study, learners reported a 9 percent improvement in productivity specifically due to the training they attended. However, when self-assessing, people tend to be overly optimistic. For this reason, the performance improvement percentage should be factored down by 35 percent to compensate for the bias. This factor is based on a dataset of 500 million student scores conducted by KnowledgeAdvisors.
The original 9 percent (approximate) improvement reported in the ESI study was factored down to 5.82 percent to compensate for self-reporting bias. Likewise, if the manager survey responses do not correlate with the student responses, additional factoring may be required to bring the two closer together.
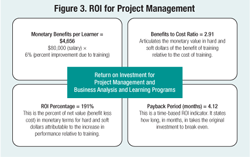
Though technically ROI is a single calculation, there are a few additional ROI-related calculations that can be performed to help communicate the impact more effectively. For instance, the ESI study calculated ROI, monetary benefit per learner, benefit-to-cost ratio, and average payback period.
Return on Investment
ROI is calculated as the return of the training (financial benefit) divided by the investment in the training (cost). The investment components were defined in step 7, but what about the return? The return is calculated by multiplying the percent performance increase by
the average student's salary. So what does salary have to do with the financial return of performance improvement? Look at it this way: on average, organizations benefit from their employees. In other words, they derive more value from them than they cost. Therefore, it can be concluded that if an individual's productivity increases by 5.82 percent, as it did in the study, then the company would benefit more than 5.82 percent. Using salary as a basis for calculating investment return is actually conservative as the real return would theoretically be higher.
As an example, here is the math used in the ESI study:
ROI
Return = $80,000 (average salary) x 5.82% (performance increase) = $4,656
Investment = $1,600 (fully loaded class cost)
ROI = ($4,656 – $1,600) / $1,600 = 191%
Per Student Monetary Benefit
This number shows only the return side of the ROI calculation. In this case, the training generated $4,656 in monetary benefit for each student taking the course.
Benefit-to-Cost Ratio
This ratio articulates the monetary value of the training relative to the cost. For the ESI study, the companies and government agencies investing in project management and business analysis training received $2.91 for every dollar they invested in training. The benefit-to-cost ratio is 2.91 to one.
Payback Period
This is a time-based ROI calculation, which indicates how long in months it will take to pay back the initial investment in the training. To calculate the payback period, divide the per student monetary benefit by 12 (months) to get the monthly benefit. Then divide the investment by the monthly benefit to get the payback period.
$4,656 (annual benefit) / 12 (months) = $388 (monthly payback)
$1,600 (investment) / $388 = 4.12 to payback the investment
Step 9: Boost the Numbers
So what if the ROI is negative or just not what it should be? Typically, this occurs for any combination of the following reasons:
the content is not relevant for the audience
the content is not delivered well
adoption of the content is not supported by the organization.
As students tend to be pretty vocal when they have to endure misaligned material or bad instruction, the course evaluations should point out these deficiencies pretty quickly. Adoption, however, is harder to detect because it takes place after the learning event where learning providers have less visibility.
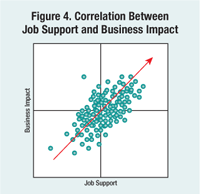
If everything else is in line, focus efforts on adoption. The data shows that manager involvement and good post support are critical to adoption. The chart below correlates job support and business impact for the more than 160 organizations represented in the ESI survey.
Each dot on the graph represents the average scores of a single organization. For any given organization, its position on the horizontal axis demonstrates how well students felt supported after the learning, and its position on the vertical axis demonstrates the business impact training had on the organization. By looking at the graph it is clear that there is a very strong correlation between job support and business impact, meaning that the better the support the student was given, the stronger the impact on the business.
The point is that focusing on adoption and job support yields the most bang for the buck. So what is job support? At the most basic level it means that students had support from their managers and were provided adequate resources and opportunities to apply the training. Here are the specific questions used in the ESI survey:
Were participant materials useful on the job (1 to 7)?
Were training expectations set with the manager prior to training (1 to 7)?
Was the use of the training discussed with the manager after the training (1 to 7)?
Were adequate resources provided to apply training on the job (1 to 7)?
Don't be discouraged by low ROI numbers. By being proactive and taking a comprehensive view of job support and other adoption practices, ROI will certainly follow.
Step 10: Tell the Story
Don't let the narrative get lost in the data. Ultimately, this is not about the numbers, it is about the story—where the program has been and where it needs to go. The story needs to be compelling and interesting. Clearly state the goals of the program as they were first envisioned, the challenges it faced and how the team overcame them to make a difference for the organization. If at all possible, include testimonials from students to help tell the story. Anecdotal evidence alone means very little, but when testimonials are combined with data to make a point, they can be a very powerful tool.
ROI is much more than a metric, it is a mindset. Extending program performance indicators to include learning effectiveness, job performance, and business results shifts the focus of the program from training delivery to organizational impact. It is an important shift because it directly aligns training with the goals and objectives of the agency.
Those learning and development organizations that are willing to change their definitions of success and align themselves with the organization in practice and mindset are much more likely to provide measureable value and deliver tangible results.


More from ATD

